Detect Overview
Immuta Detect is a tool that monitors your data environment and provides analytic dashboards in the Immuta UI based on your data use. These dashboards offer visualizations of audit events, including user queries and when Discover classification is enabled, the sensitivity of those queries, data sources, and columns. It can work within your current Immuta integration.
Immuta Detect continually monitors your data environment to help answer questions about your most active data users, the most accessed data, and the events happening within your data environment. Detect can provide even more value with Discover classification enabled to answer questions about the sensitive data accessed by your users and the tables that contain sensitive data. Because of this information, your organization can do the following:
- Meet compliance requirements more effectively
- Quickly decide what data access is allowed for what purposes
- Reduce the effort and time to respond to auditors about data access in your company
- Reduce the effort of classifying data within the scope of security or regulatory compliance frameworks
Recommended: Use Discover classification when using a Snowflake integration.
You have the option to use Immuta Detect on its own or, if you are using a Snowflake integration, to enable Discover to classify your data. There are benefits to both, but for the fullest functionality, greatest value, and best experience, it is recommended to enable and tune classification.
Detect with Discover
Only available with Snowflake integrations.
Benefits
- Dashboards with data activity patterns for data sources and users
- Dynamic query sensitivity on joined tables calculate sensitivity based on the columns queried and their toxicity when joined
- Dashboards to help users find the most recently accessed data sources and active columns
Architecture
Immuta Detect uses several features of the Immuta platform to create user-friendly dashboards that are always available
in the UI
and do not need to be generated like Immuta reports. These dashboards are created by combining Snowflake audit events
from registered users
and the sensitivity of your data. Audit information and events are gathered from the Snowflake ACCOUNT_USAGE views
into Immuta Detect. Additionally, Immuta Discover calculates the sensitivity of your data using
Immuta built-in frameworks: the Data Security Framework and Risk Assessment Framework, which find sensitive data on a column-by-column
basis using tags applied by SDD. Once Immuta does this work behind the scenes, users with the AUDIT permission will
see dashboards that show the sensitive data within your organization’s data environment and what users are accessing
that data.
Sensitivity
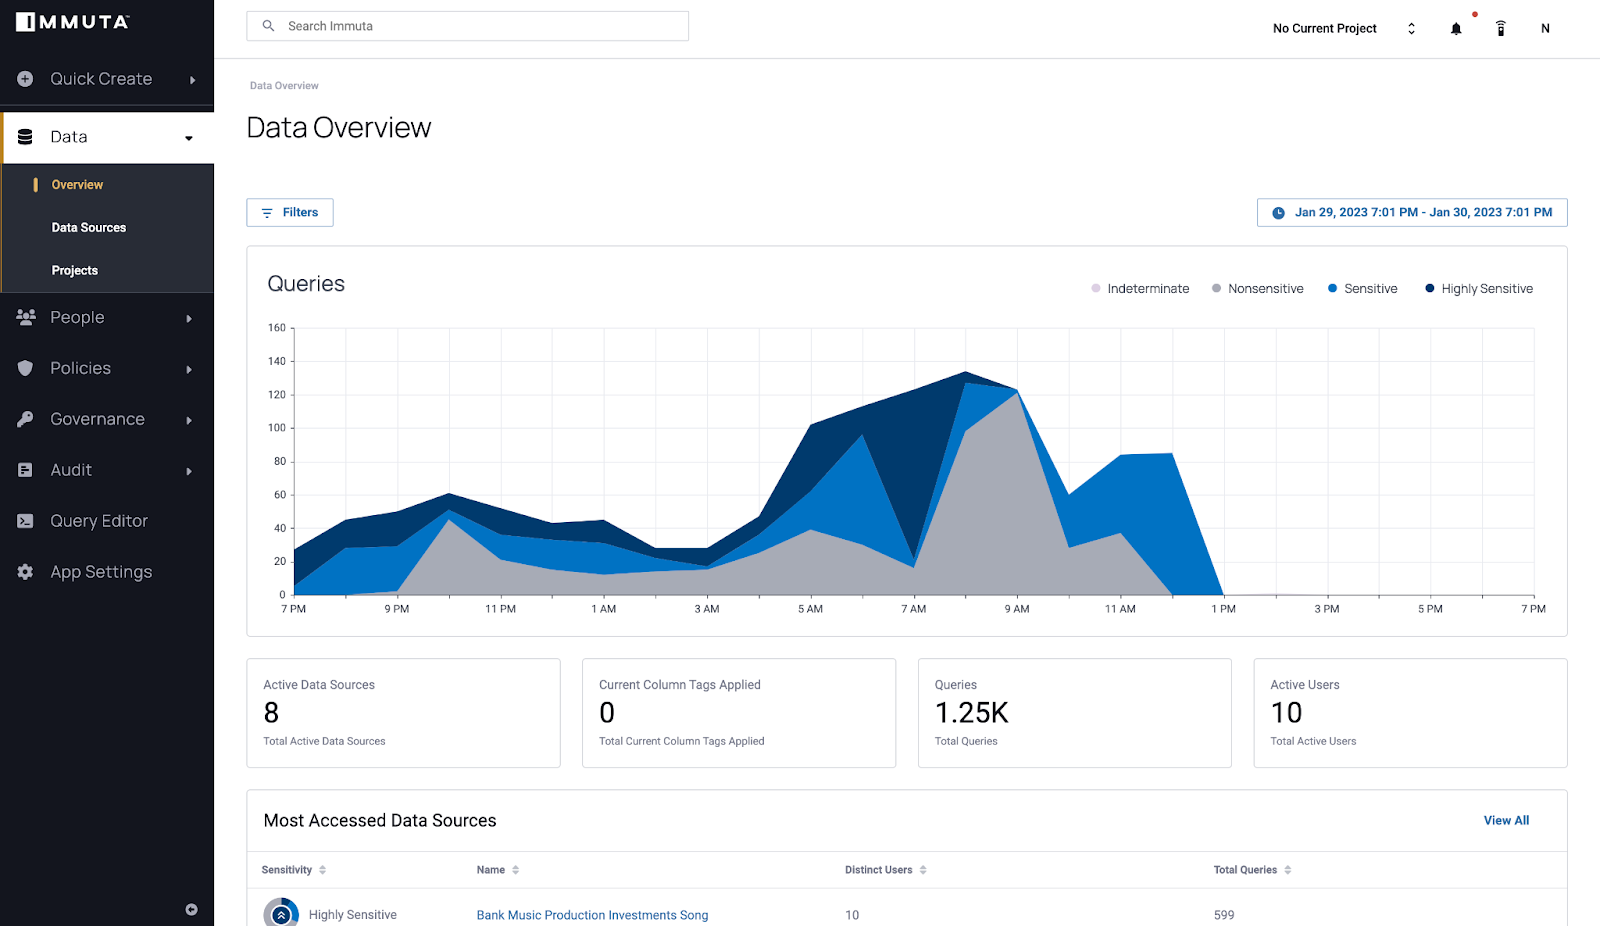
With Discover classification enabled, Immuta qualifies both columns and queries as the following sensitivity types in the dashboards:
- Highly sensitive: Includes data that can cause severe harm or loss with inappropriate access or misuse.
- Sensitive: Includes personal data and data that could cause harm or loss with inappropriate access or misuse.
- Non-sensitive: Includes publicly available information or data that would not typically cause harm or loss if disclosed.
- Indeterminate: The sensitivity of the data is unknown. Immuta deems sensitivity indeterminate because of an error in the query or because the sensitive data discovery (SDD) or classification has not completed processing at the time the query was run.
How does Immuta determine column sensitivity?
Column sensitivity is determined by the classification tags applied to the columns by the frameworks. The classification tags contain sensitivity metadata.
How does Immuta determine query sensitivity?
For queries that read from a single table, query sensitivity is determined by the column with the highest sensitivity in the query
For a query that joins tables, Immuta uses the same classification rules applied to tables and applies those rules to columns of the query. Immuta applies a new set of classification tags to the query columns and calculates sensitivity for the query event in the audit record. These query classification tags are not included on the tables' data dictionary.
Detect without Discover classification
Benefits
- Quicker and easier onboarding experience
- Dashboards with data activity patterns for data sources and users
- Dashboards to help users find the most recently accessed data sources and active columns
Architecture
Immuta Detect uses several features of the Immuta platform to create user-friendly dashboards that are always available
in the UI and do not need to be generated like Immuta reports. These dashboards are created from audit information and
events gathered from Snowflake, Databricks Spark, and Databricks Unity Catalog into Immuta Detect. Immuta pulls audit
information from Snowflake and Databricks Spark for data sources and users registered in Immuta; for Databricks Unity
Catalog, Immuta pulls in audit information for all users and tables. Users with the AUDIT permission will see
dashboards that show the data events within your organization’s data environment and what users are accessing that
data.
Detect features
User, data, and audit dashboards
Immuta Detect provides at-a-glance dashboards to monitor change in user activity, data access, and security posture.
Universal audit model (UAM)
Immuta’s universal audit model (UAM) and export features allow you to export the full audit logs to S3 and ADLS for long-term backup and processing with log data processors and tools. This capability fosters convenient integrations with log monitoring services and data pipelines.
With UAM, you can specify an S3 bucket destination where Immuta will periodically export audit logs. The events captured are only events relevant to user and system actions that affect Immuta or the integrated data platforms, such as creating data sources and running queries.
Limitations
-
The Detect dashboard shows near real-time events for Immuta events, such as login, policy changes, and data platform policy changes. Query events are ingested from Snowflake and Databricks once a day, but you can manually trigger an immediate query retrieval by using the ↻Native Query Audit button on the Audit page or the Load Audit Events button on the Audit page. To update your automatic query retrieval, edit your integration.
The most recent query history that is available to Immuta Detect depends on the underlying data platform latency. For example, there is up to three hours of latency between an executed query and recording the event on the Snowflake data platform side.
-
Detect with Databricks Spark and Databricks Unity Catalog does not support using Discover classification to determine query sensitivity at this time.