Use the Detect Dashboards
Requirement: Immuta permission AUDIT or data owner
The Detect dashboards are visualizations of the data being queried in your data environment, how sensitive it is, and who the active users are. Use the guides below to adjust a dashboard to show the information you're most interested in.
Applying filters
You can filter dashboards in several ways and use multiple filters at once. To filter a dashboard,
- Click Filters.
- Select the filter you want, and select the type.
- Repeat this process as necessary for any filters you want to apply to the dashboard.
To remove the filters, click the delete (X) icon.
Note: For a more responsive experience, Immuta limits the number of auto-suggested filter values to 100 of the most active values. The total item count for each filter type still reflects the number of events in the dashboard time range.
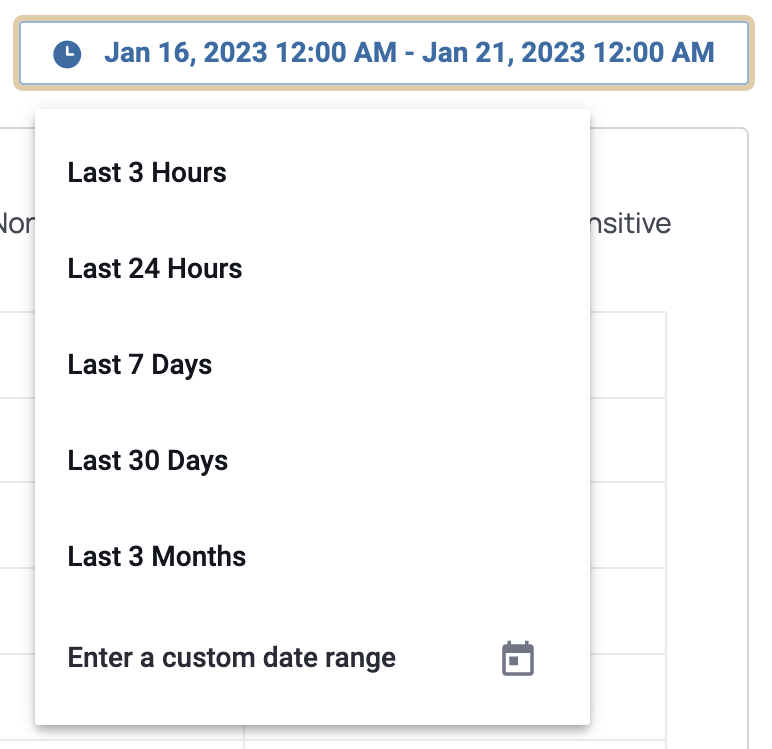
Setting a time range
By default the time range for all dashboards is 24 hours. To select a different time range,
-
Click the date range.
-
Select the time range you want from the options, choose to enter a custom date range, or choose to enter a custom time range in hours.
Note this will revert back to the default when you log out.
Filter graph using sensitivity types
By default all sensitivity types and indeterminate will appear on the graph if you have set up classification.
- To take off specific sensitivity types, select the name of the sensitivity type from the chart legend that you do not want on the graph. The icon color will change to dark gray to signal it is not represented on the graph.
- To add specific sensitivity types, select the name of the sensitivity type you want on the graph. The icon color will change from dark gray to the color it is represented by on the graph (blue or light gray).
Note this will only affect the dashboard you are viewing and will revert back to the default when you navigate away from the page.
Manually sync new events
Audit events from Snowflake and Databricks Unity Catalog are ingested on a configurable schedule; however, users can manually pull in audit events from these integrations at any time by completing the following steps.
- Navigate to the Audit page.
- Click Load Audit Events.
The ingestion job may take time to finish, but will complete in the background. Once it is complete, the new audit events will populate on the events page.